Veloce: A Planning Platform for RF Engineers
Replacing scattered spreadsheets with one map RF engineers can plan from.
- Problem
- Engineers weighed cost, coverage, compatibility and geography across disconnected spreadsheets.
- My part
- The dashboard, the icon and logo sets, and one-on-one interviews with engineering leads.
- Decision
- Anchor the product on a map, with layers to compare and filter deployments.
- Outcome
- Designs went to engineering, and the wider platform cut core RF tasks from hours to minutes.
Overview
I joined a small team as a UX designer to build a planning platform for RF engineers under Veloce, T-Mobile's automation initiative. The question from the start: how do you present dense technical information so it actually helps the people using it?
The problem
RF engineers work with some of the densest information in telecom. Before a deployment went live, they had to weigh:
- Cost
- Coverage range
- Technology compatibility
- Geographic constraints
The data lived in separate spreadsheets with no shared view. Our job was to bring it together without losing the precision engineers relied on.
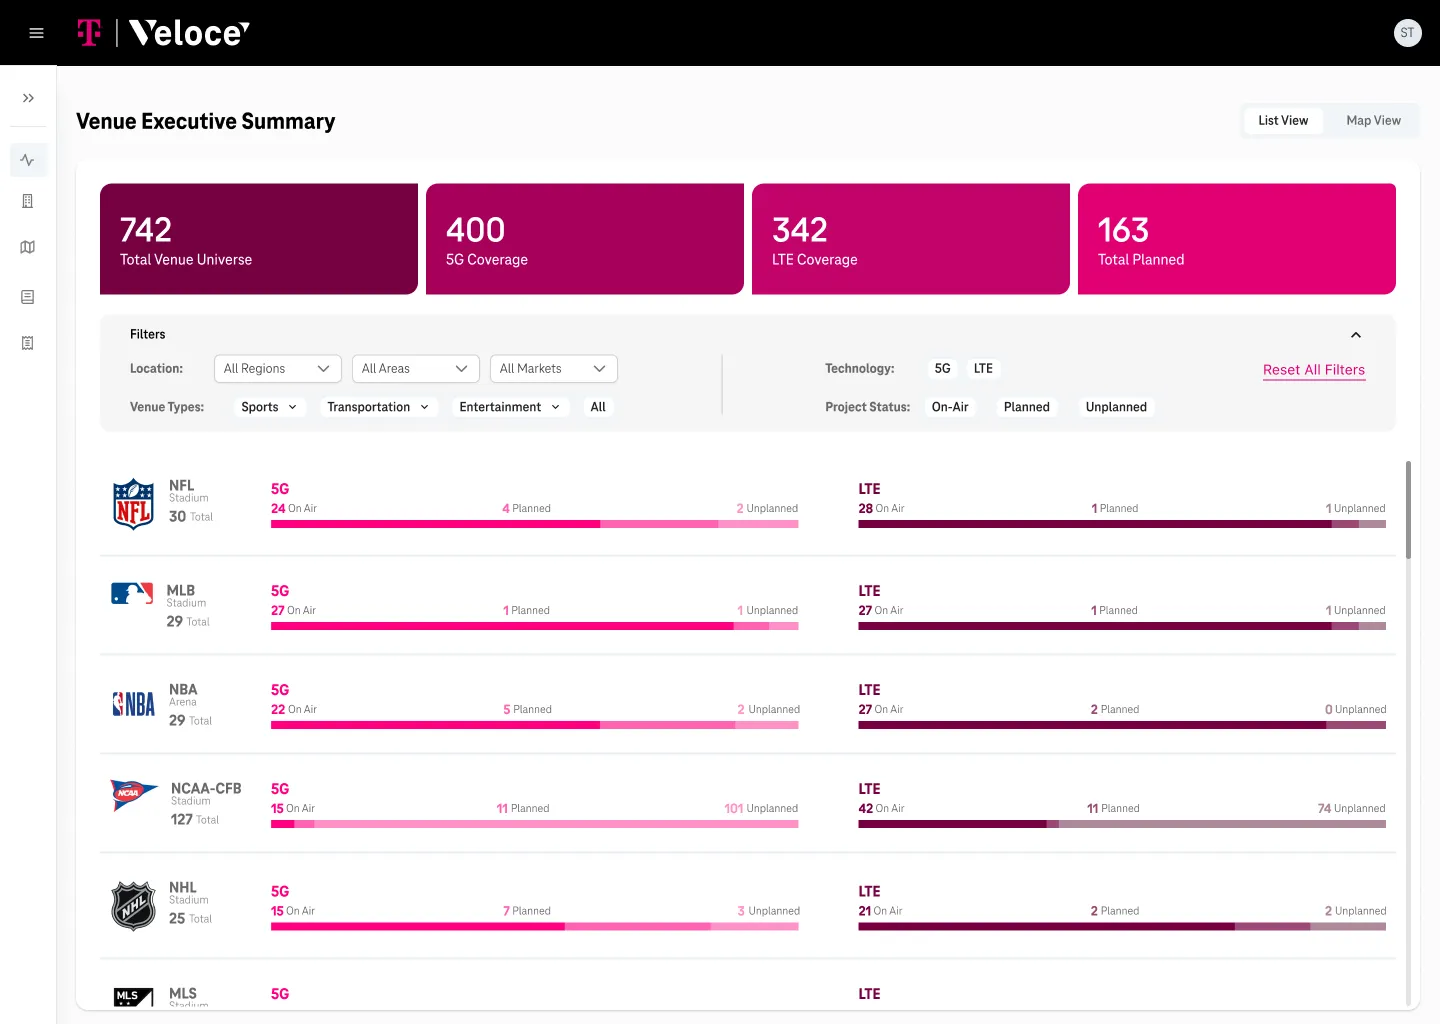
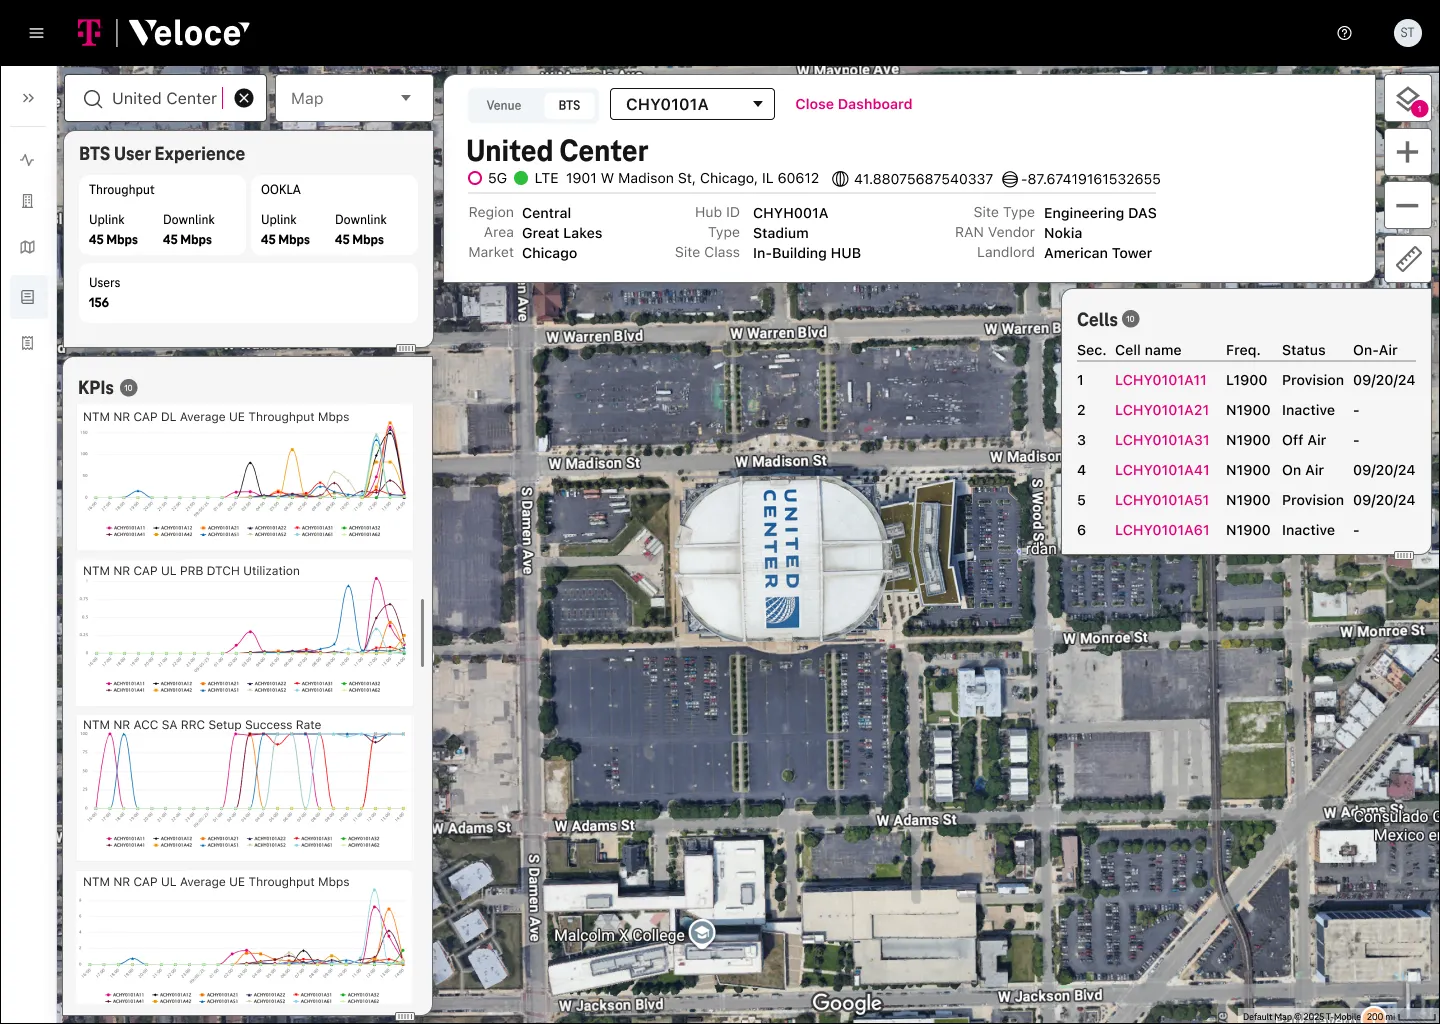
Starting from the map
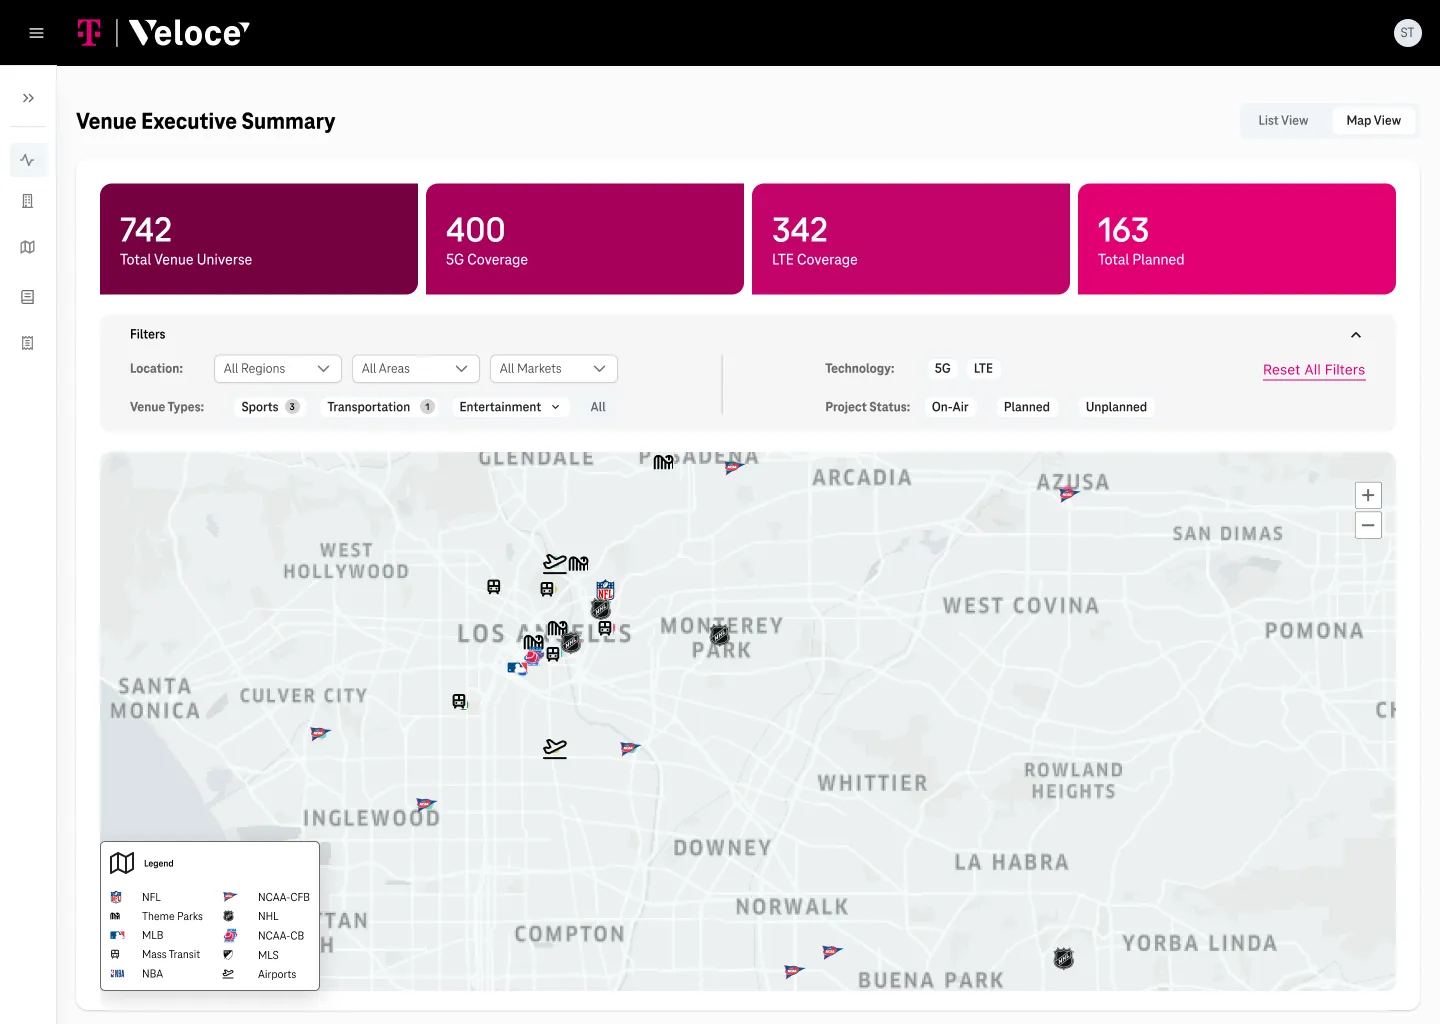
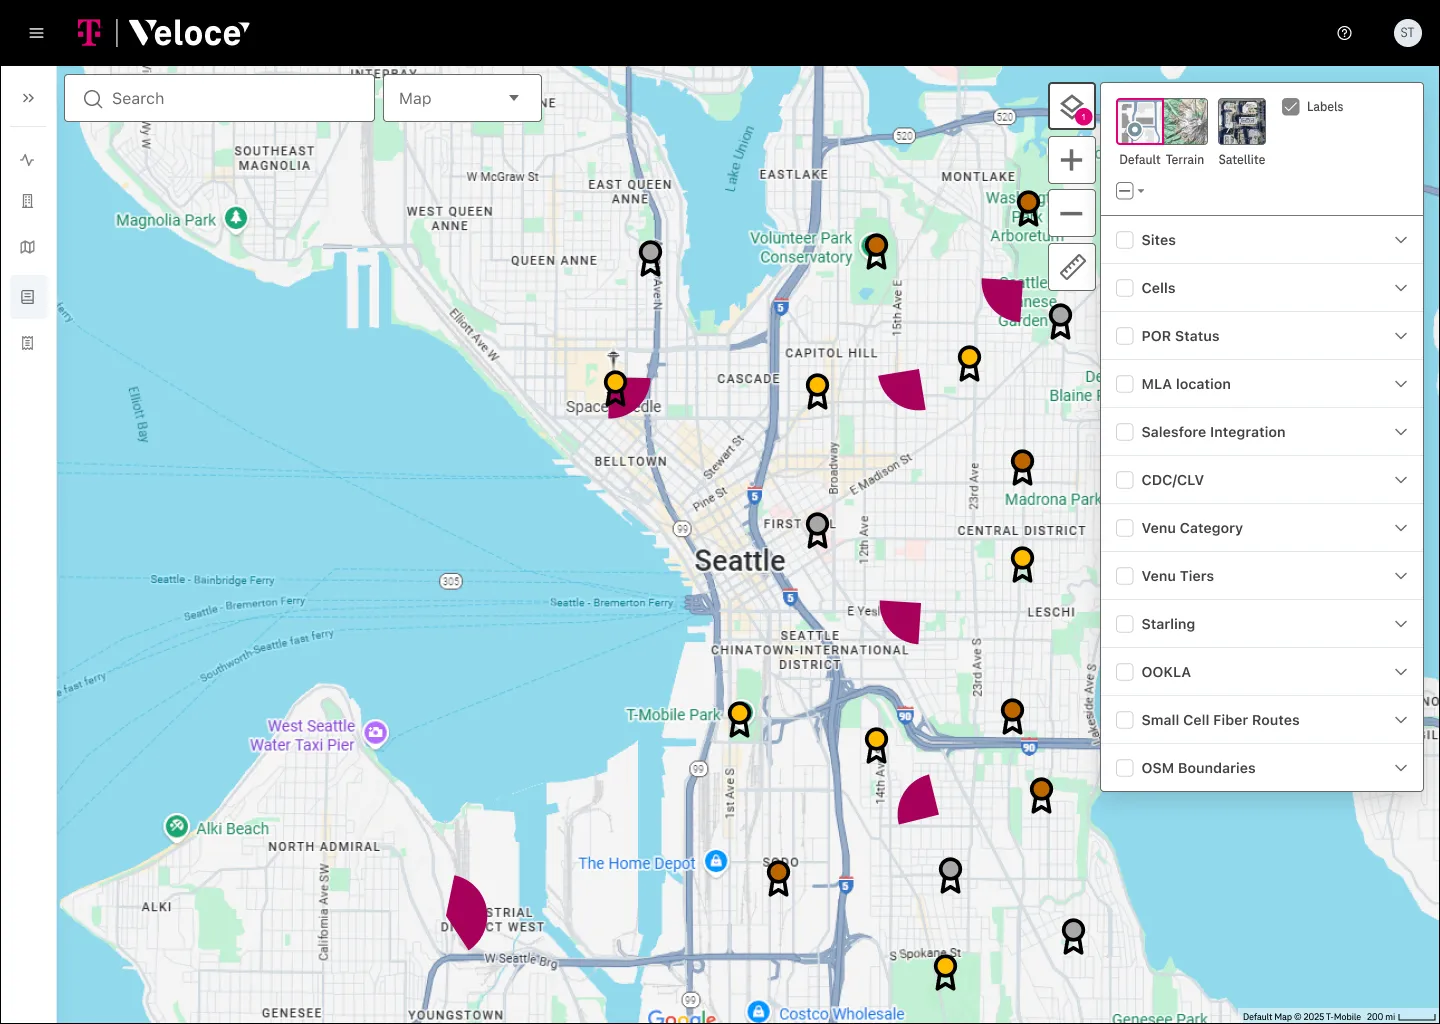
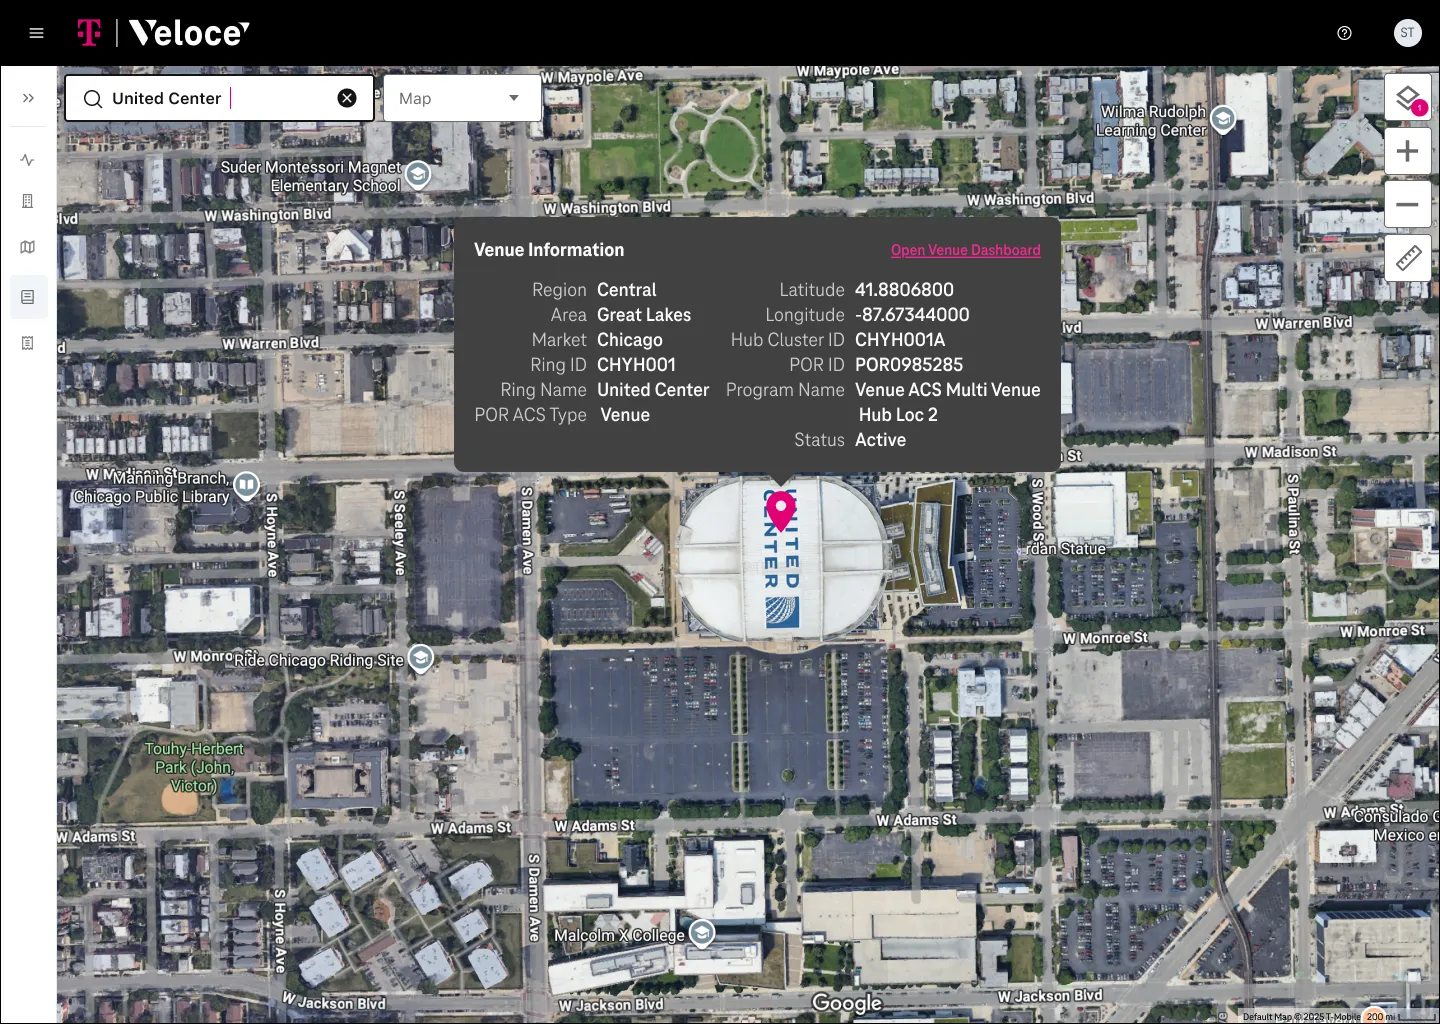
With our engineering lead as product owner, we built the product around a map. Location was the first thing engineers looked for, and everything else made more sense once it sat there. Layers became the core interaction, so engineers could compare and filter deployments without losing the bigger picture.
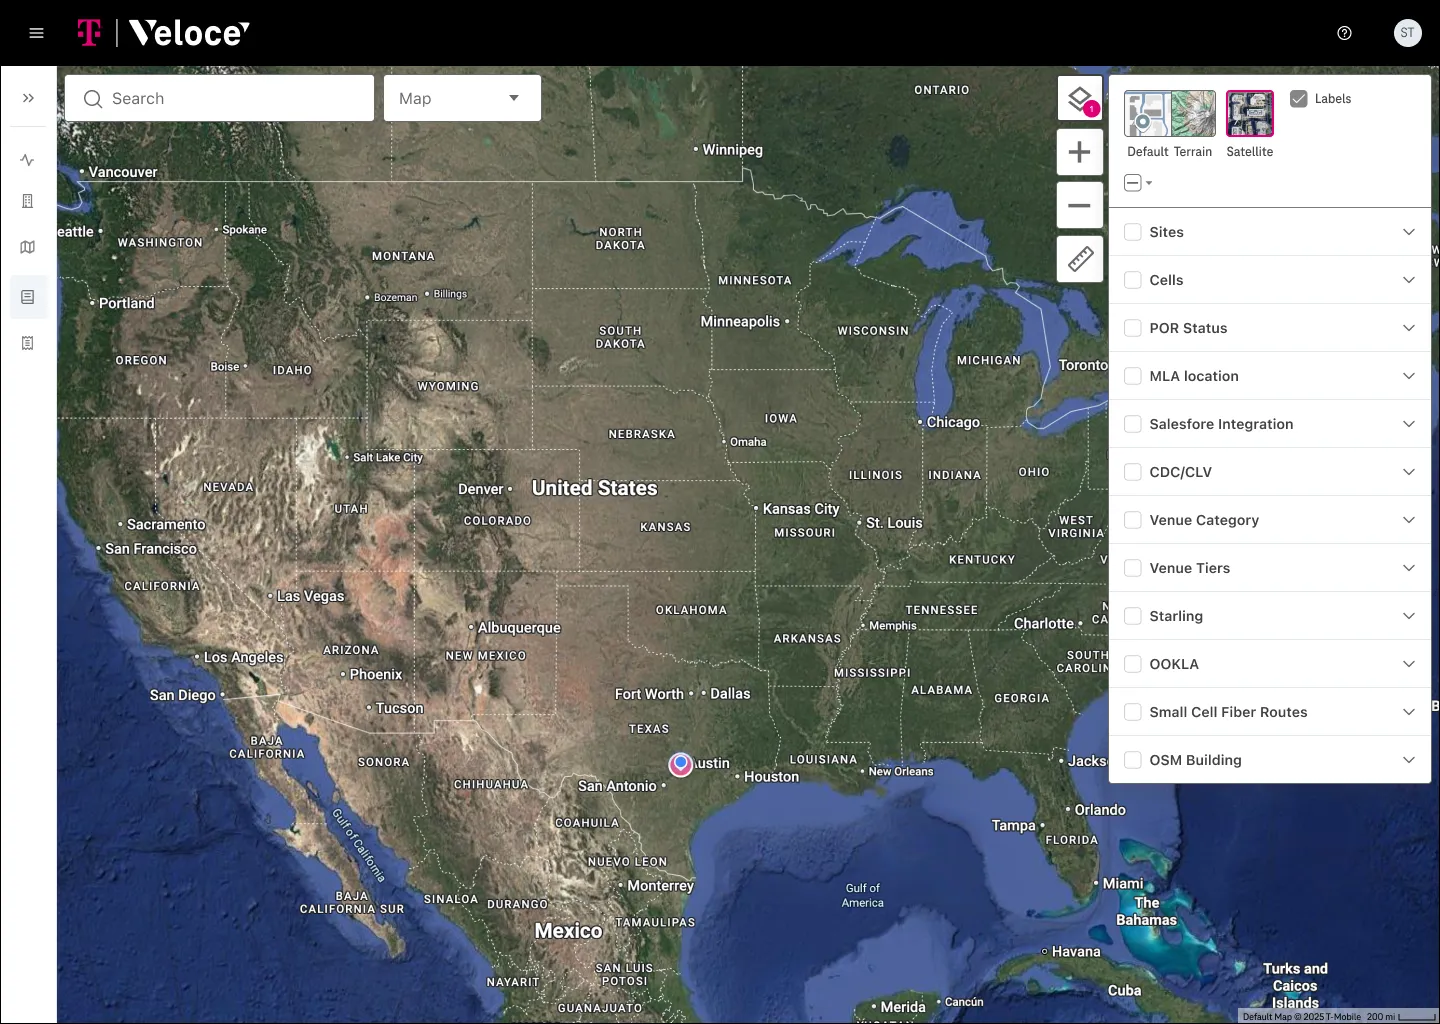
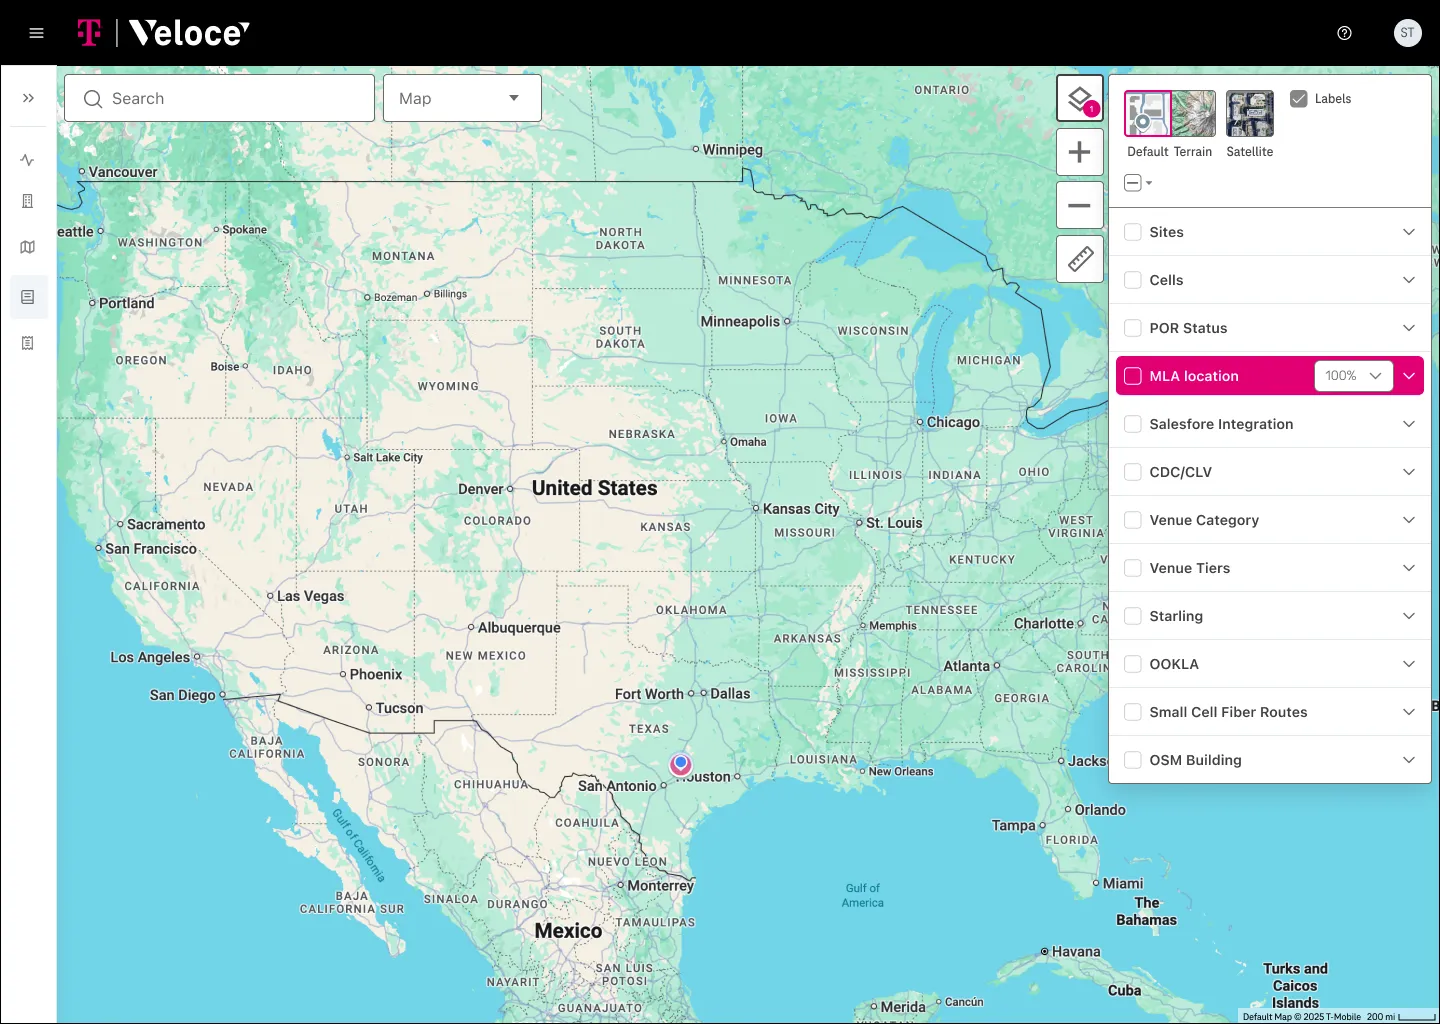
Adapting to feedback
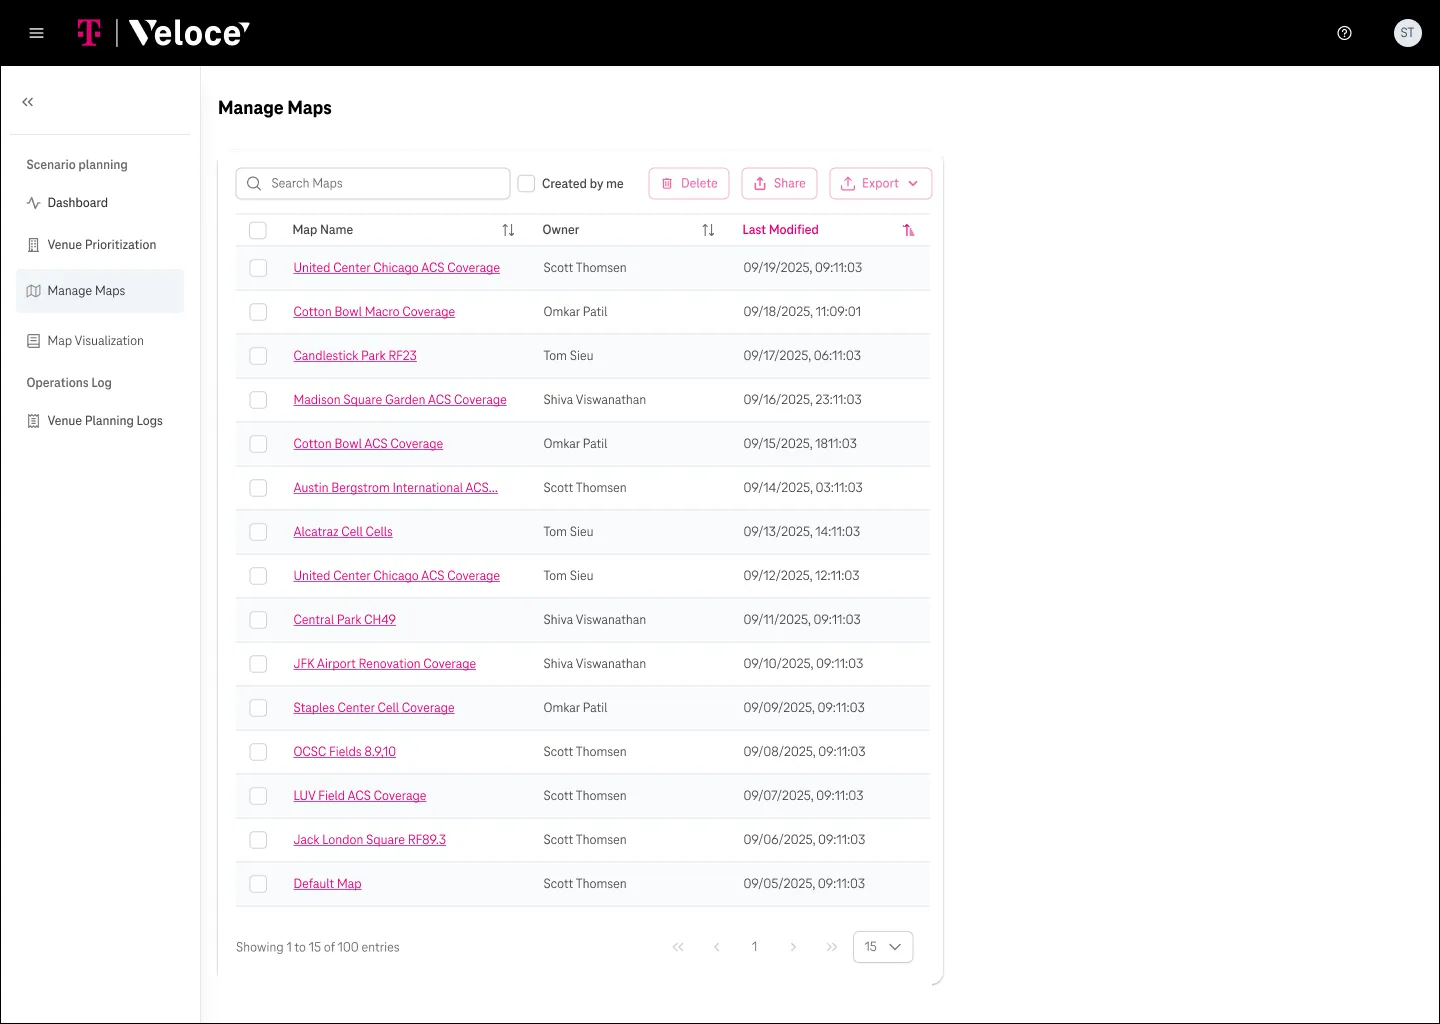
Engineer feedback revealed gaps we hadn't planned for: more data types, new layer sets and a way to manage saved maps. We added all three.
What I owned
Scott and I split the product. I owned the dashboard, icons and logos; Scott owned the map's layer system. We reviewed each other's work throughout, and the designs went to engineering for development.
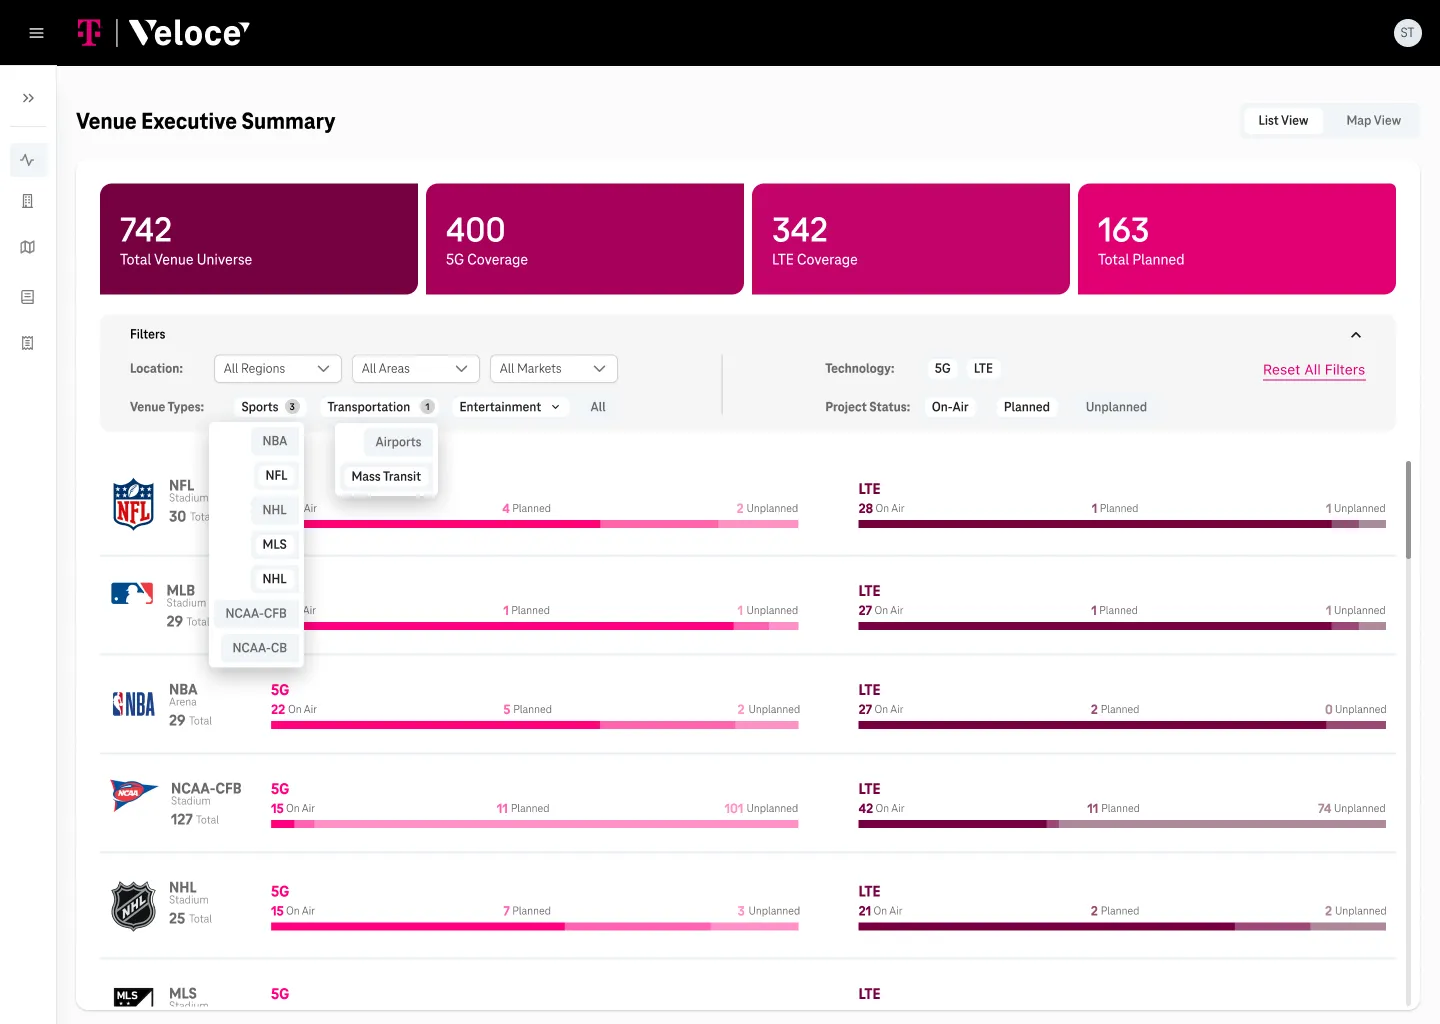
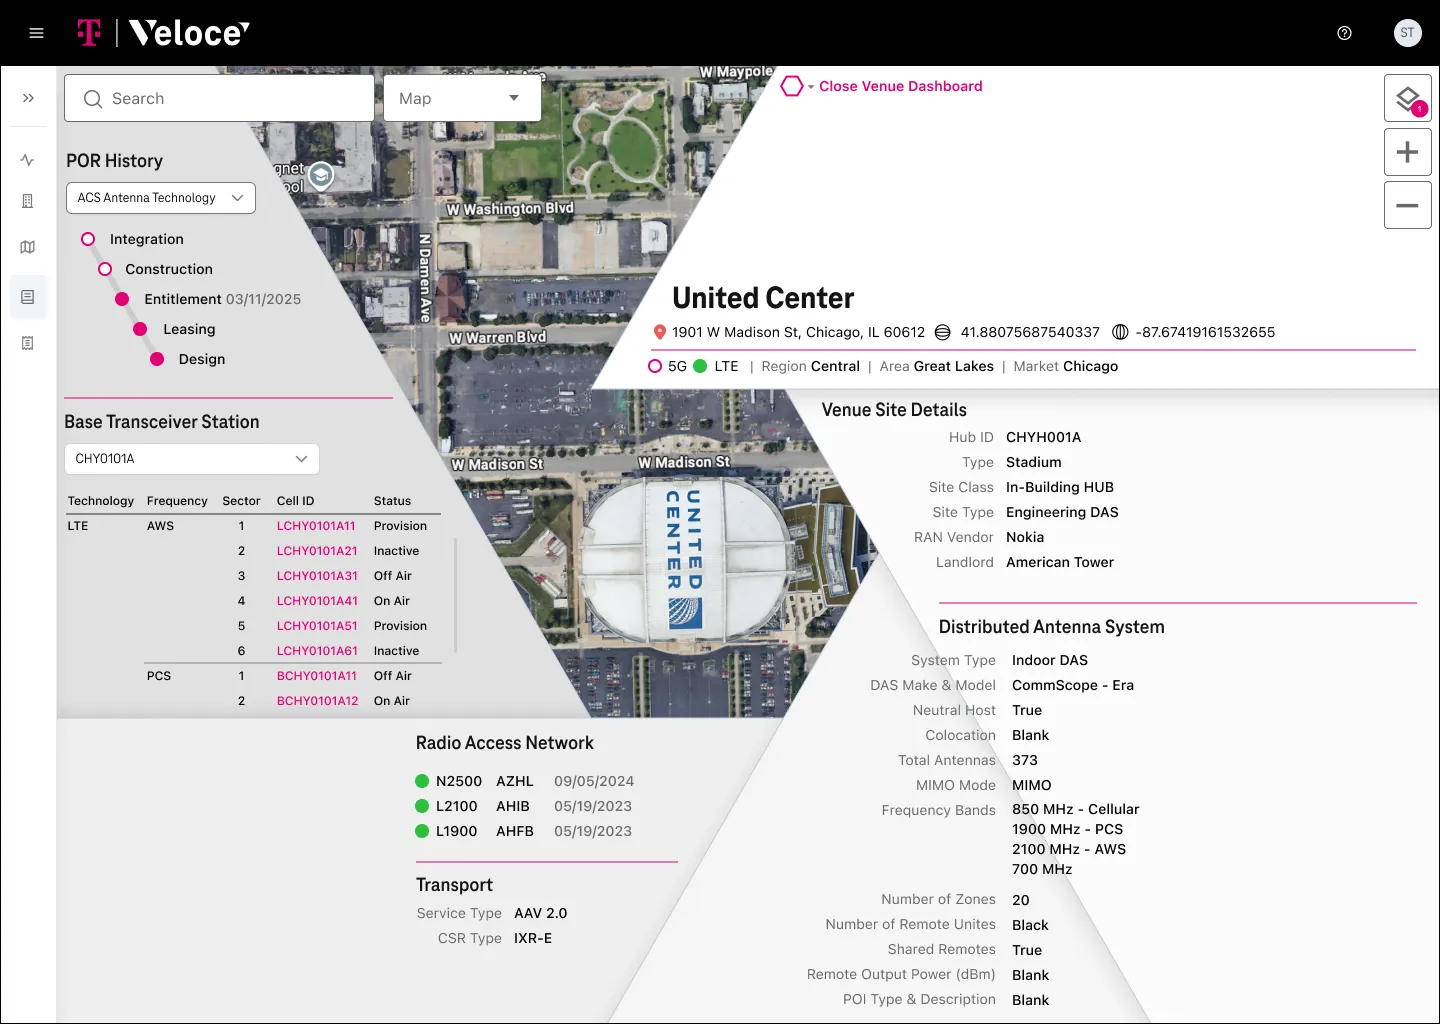
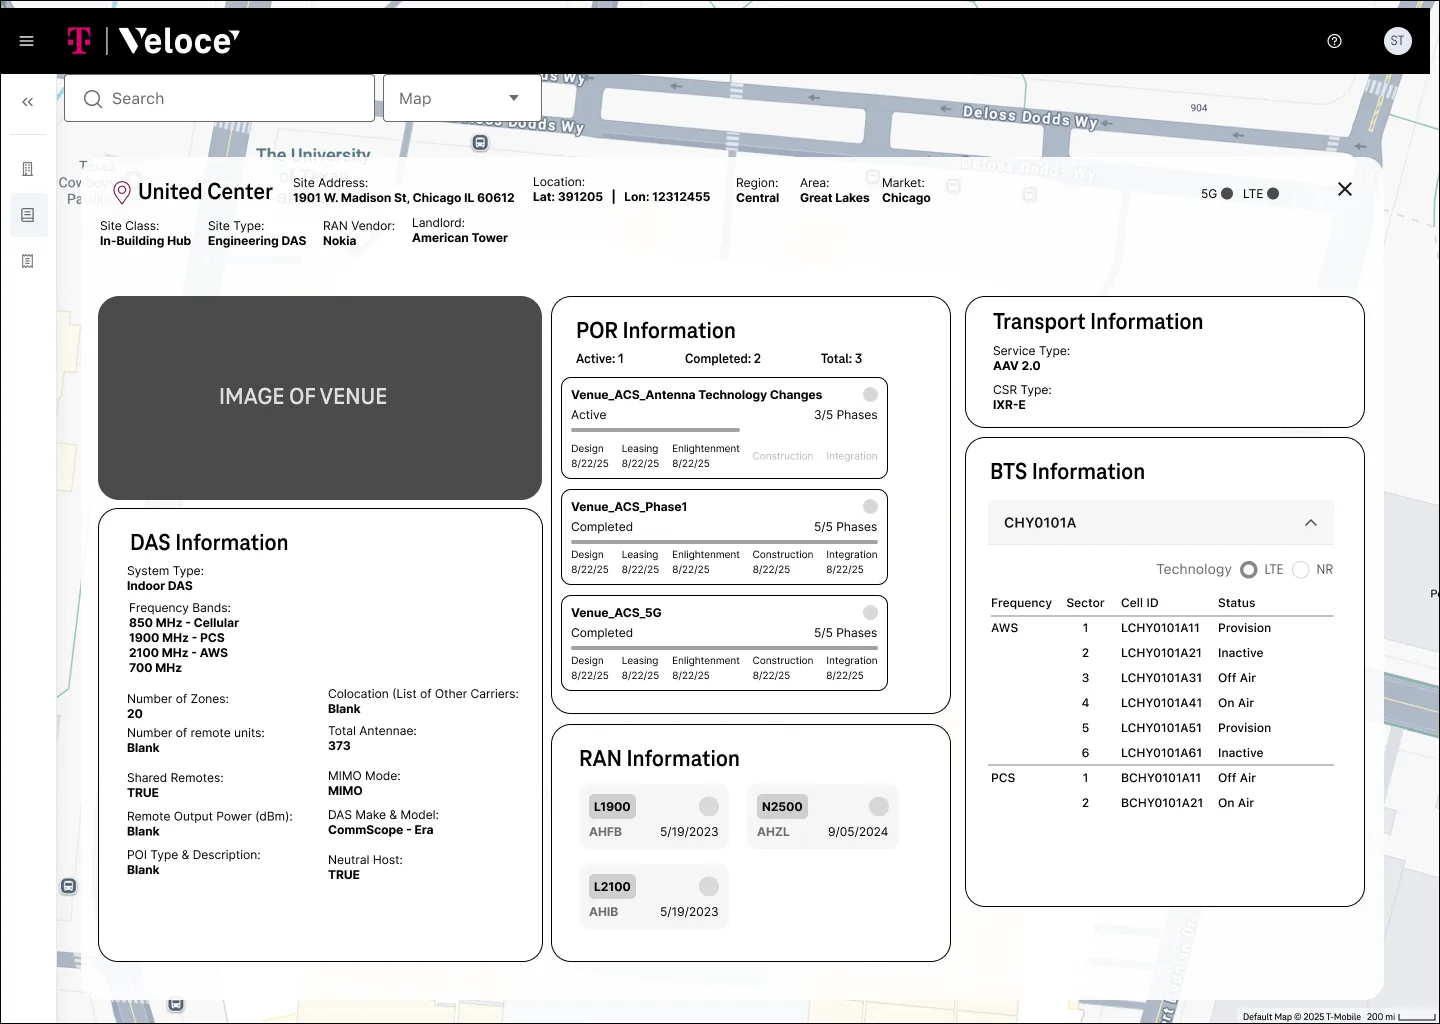
The result gave dense data a visual language engineers could reason with. It kept all the information but made decisions faster and easier to defend. The wider Veloce platform went on to cut core RF tasks from hours to minutes.
Research: listening to the engineering group
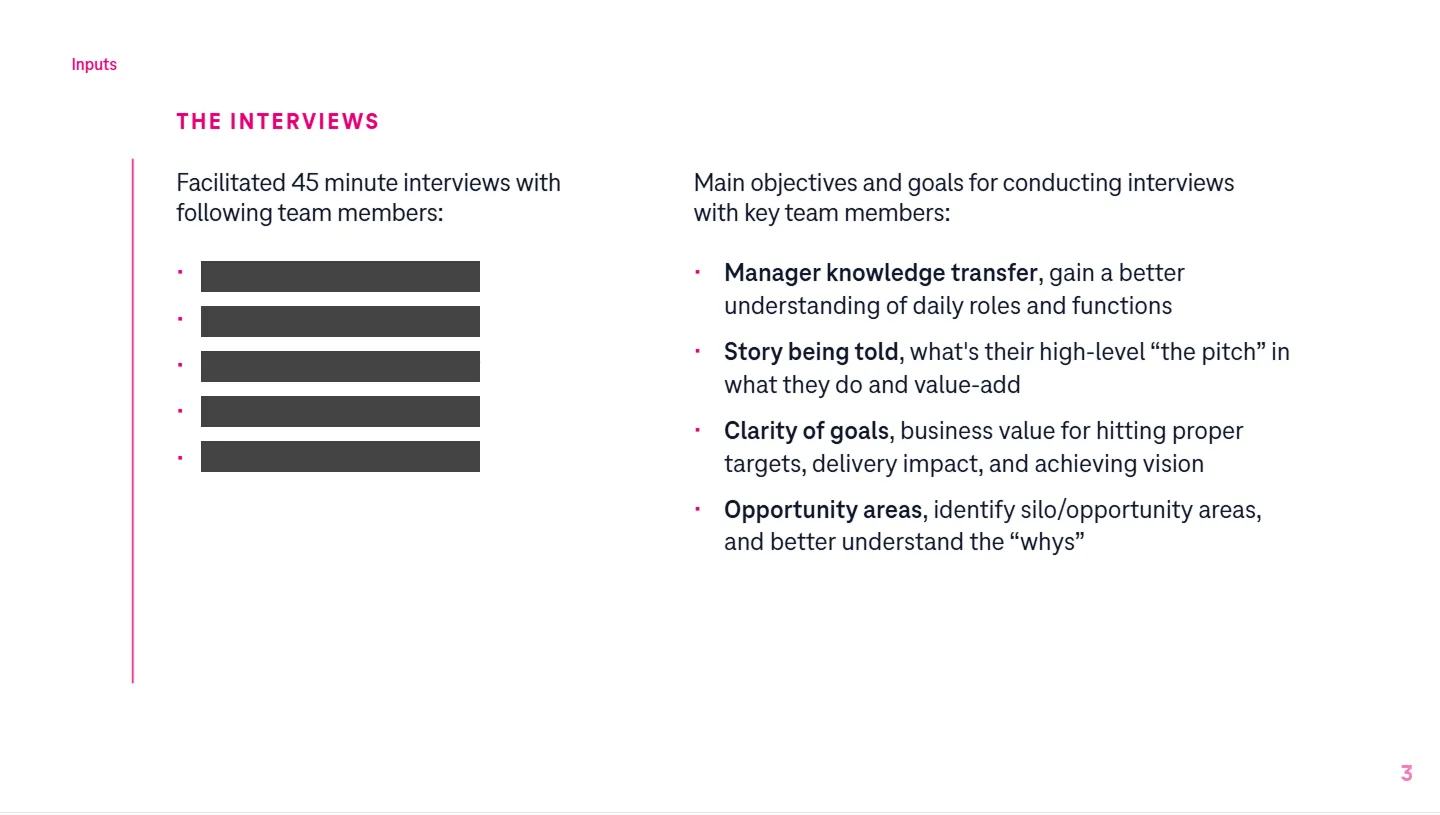
Next we interviewed six leads from a field engineering and operations group that had recently started working together. We wanted to know each person's role, what they valued, where their work broke down, and where Veloce could fit into their day.
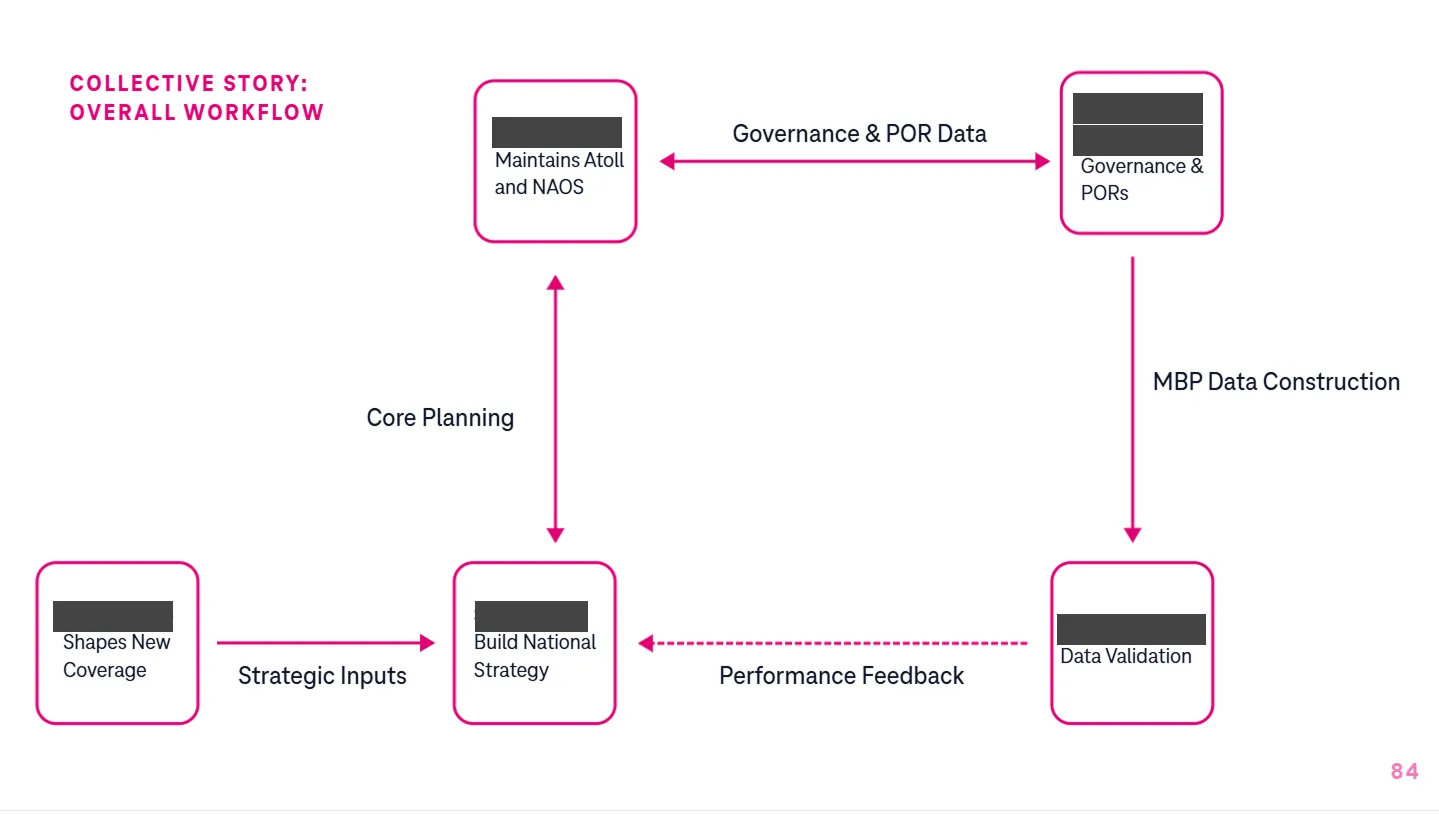
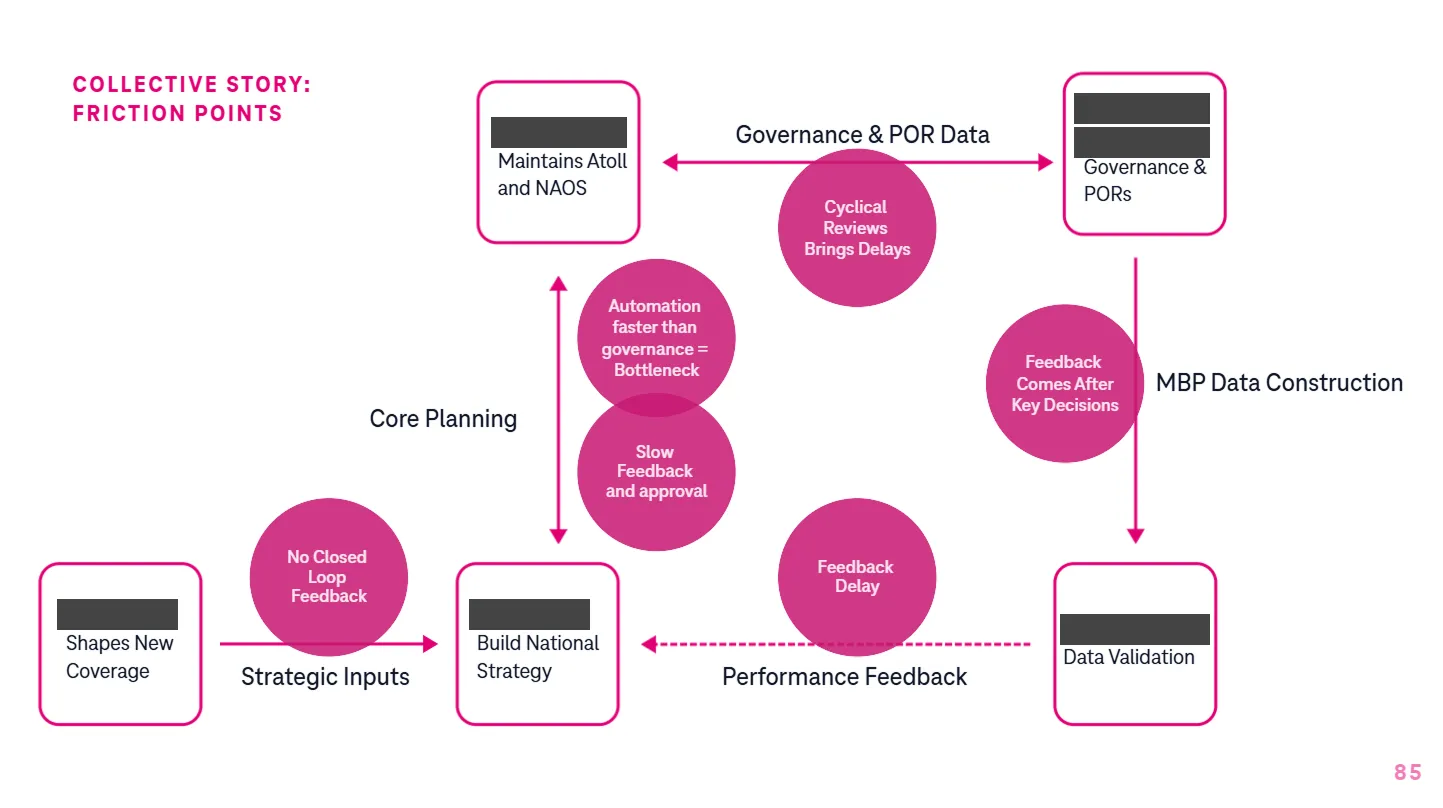
We spoke to each person one on one. Describing their own work, everyone brought up their colleagues: how they worked together, where handoffs failed, what they wished the other side understood. Pulling those threads together mapped relationships a survey or group session would have missed.
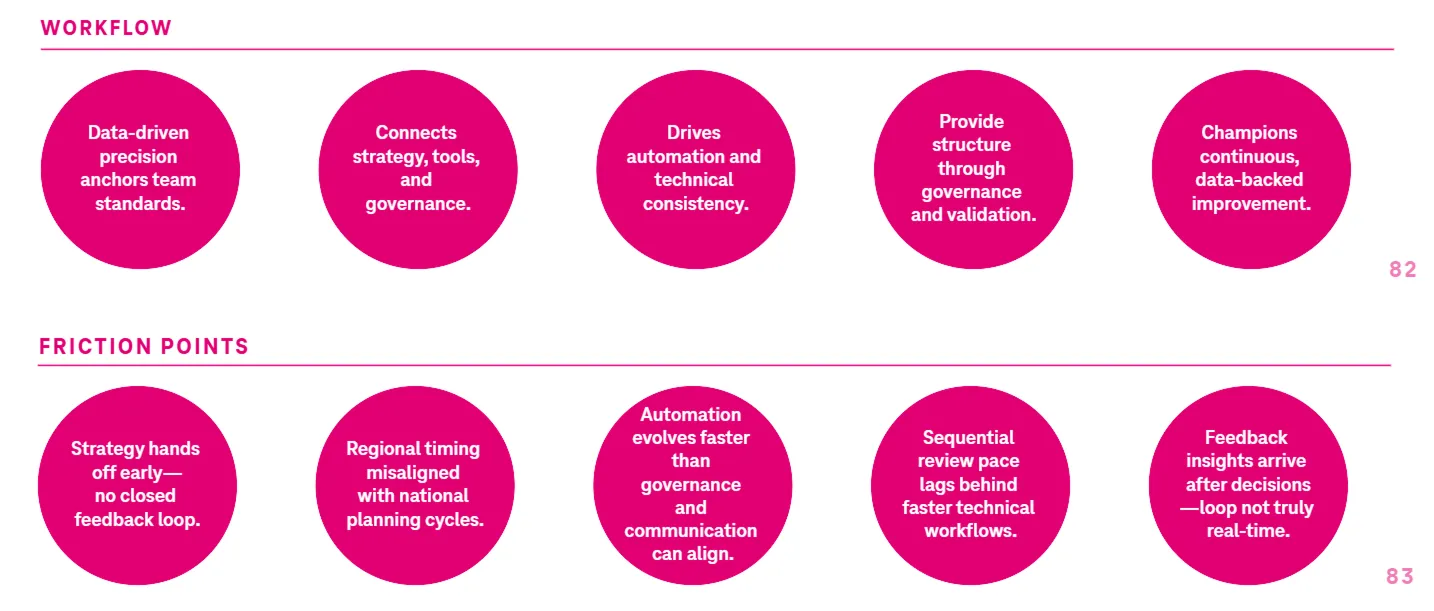
For each lead we wrote a story, a set of opportunities and a short roadmap showing where Veloce could take manual work off their plate. All six needed the same things: less manual work, clearer alignment, and one trusted system from planning to performance.
Outcomes
- Veloce dashboard and icon system handed off to engineering
- Research mapped where Veloce fit into six leads' workflows
- The wider Veloce platform cut core RF tasks from hours to minutes
What came next
That shared need became the logic for everything that followed. Then the group was reorganized, a new strategy org formed above it, and our work moved into strategy, naming, identity and video. That story is in the T-Mobile case study.